Car crashes affect thousands of people in Orange County every year, from drivers and passengers to motorcyclists, bicyclists and pedestrians. This guide brings together the latest official Orange County car accident statistics to show where the biggest risks appear: speeding, alcohol-involved crashes, hit-and-runs, nighttime collisions and vulnerable road users.
The data comes from California Office of Traffic Safety rankings, SWITRS/TIMS resources, Caltrans road-safety materials and city-level OTS reports. Because these sources measure different things, this guide separates victims killed or injured, fatal-and-injury collisions, DUI arrests, rankings and city-level figures instead of treating them as one combined crash count.
Key Takeaways
- Orange County had 17,809 victims killed or injured in total fatal-and-injury crashes in 2023. (California OTS, Orange County 2023)
- Orange County recorded 4,062 speed-related fatal and injury collisions in 2023.
(California OTS, Orange County 2023) - Alcohol-involved crashes accounted for 1,771 killed or injured victims in Orange County in 2023.
(California OTS, Orange County 2023) - Orange County had 1,286 hit-and-run fatal and injury collisions in 2023.
(California OTS, Orange County 2023) - Orange County had 1,116 bicyclist victims killed or injured in 2023. Bicyclist victims under 15 ranked 2/58 among California counties.
(California OTS, Orange County 2023) - Anaheim and Santa Ana had the highest total fatal-and-injury victim counts among the reviewed Orange County cities. Anaheim reported 2,135 victims, while Santa Ana reported 1,972.
(Anaheim OTS 2023), (Santa Ana OTS 2023)
Orange County Crash Overview
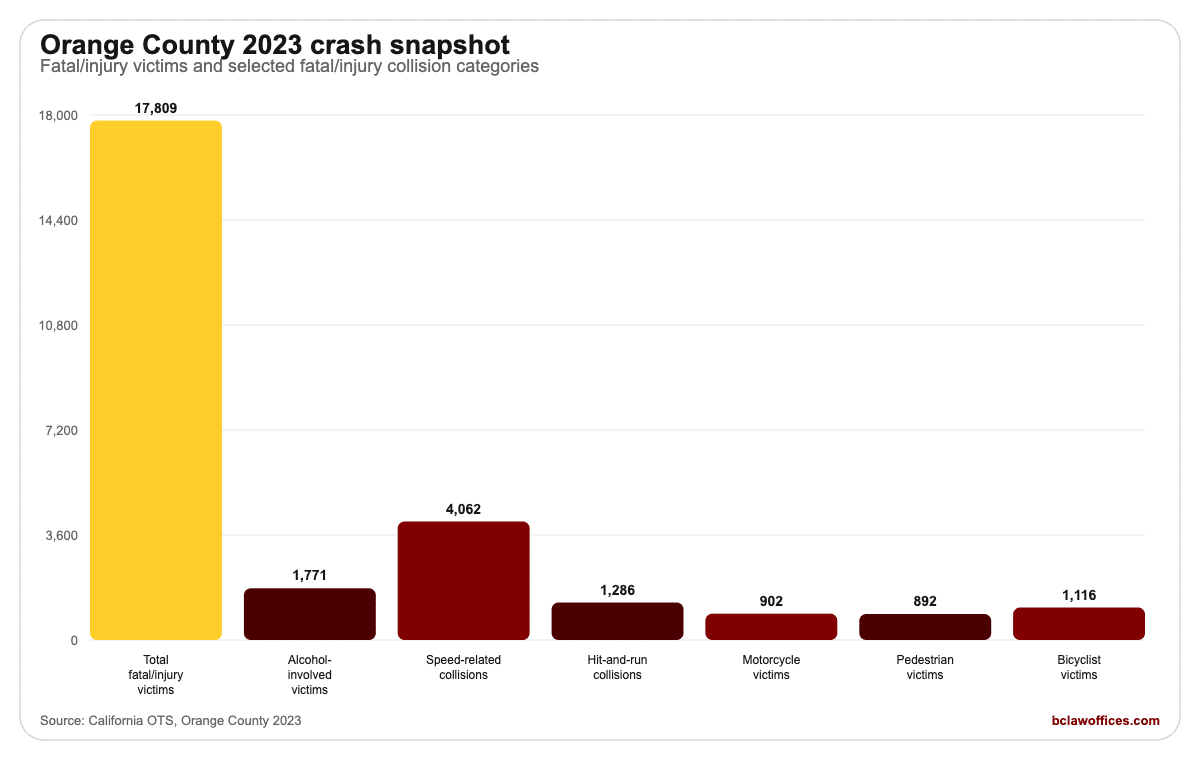
Orange County’s 2023 crash data shows the scale of injury-producing traffic collisions across the county. The OTS figures below focus on crashes where someone was killed or injured, so they should not be read as a count of every traffic accident or property-damage-only collision.
- Orange County had 17,809 victims killed or injured in total fatal-and-injury crashes in 2023.
(California OTS, Orange County 2023) - Orange County ranked 56th out of 58 California counties for total fatal-and-injury victims in 2023. OTS ranking number 1 is the highest or “worst,” so a 56/58 ranking indicates a lower relative ranking after OTS weighting.
(California OTS, Orange County 2023), (OTS methodology) - Orange County’s 2023 OTS population estimate was 3,170,070.
(California OTS, Orange County 2023) - Orange County’s 2023 daily vehicle miles traveled estimate was 64,149,910.
(California OTS, Orange County 2023) - Orange County had 902 motorcycle victims killed or injured in 2023.
(California OTS, Orange County 2023) - Orange County had 892 pedestrian victims killed or injured in 2023.
(California OTS, Orange County 2023) - Orange County had 1,116 bicyclist victims killed or injured in 2023.
(California OTS, Orange County 2023)
Orange County 2023 Crash Snapshot
Orange County Crash Trends: 2022 vs. 2023
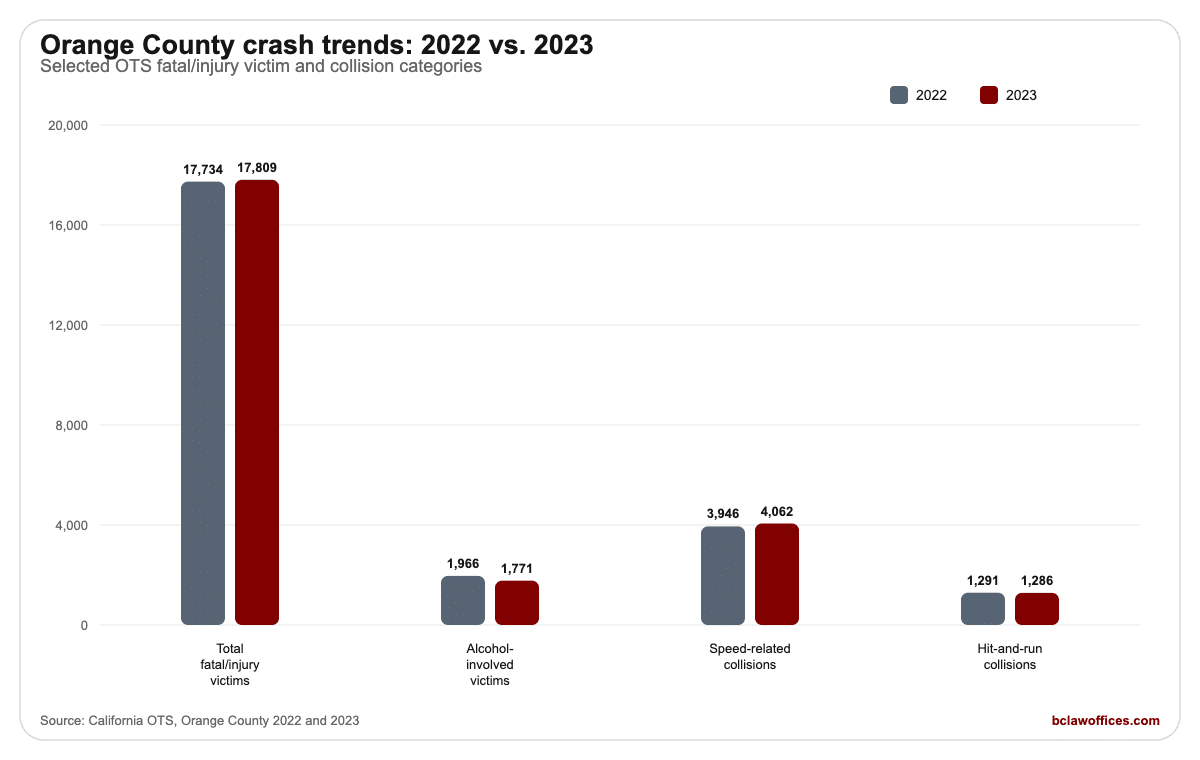
Comparing 2022 and 2023 helps show which Orange County crash categories moved up or down year over year. The total number of people killed or injured increased slightly, while alcohol-involved and hit-and-run categories declined in the OTS data.
- Orange County total fatal-and-injury victims increased from 17,734 in 2022 to 17,809 in 2023. That is an increase of 75 victims.
(California OTS 2022), (California OTS 2023) - Alcohol-involved killed or injured victims decreased from 1,966 in 2022 to 1,771 in 2023. That is a decrease of 195 victims.
(California OTS 2022), (California OTS 2023) - Speed-related fatal and injury collisions increased from 3,946 in 2022 to 4,062 in 2023. That is an increase of 116 collisions.
(California OTS 2022), (California OTS 2023) - Hit-and-run fatal and injury collisions decreased from 1,291 in 2022 to 1,286 in 2023. That is a decrease of 5 collisions.
(California OTS 2022), (California OTS 2023)
2022 vs. 2023 Orange County Comparison
DUI and Alcohol-Involved Crash Statistics
Alcohol-related crash data helps show how impaired driving affects Orange County injury collisions. OTS separates alcohol-involved victim counts from DUI arrest counts, so the figures below should not be treated as the same measure.
- Orange County had 1,771 alcohol-involved victims killed or injured in 2023.
(California OTS, Orange County 2023) - Orange County ranked 57/58 for alcohol-involved killed or injured victims in 2023.
(California OTS, Orange County 2023) - Orange County had 119 killed or injured victims in crashes involving a driver under 21 who had been drinking in 2023.
(California OTS, Orange County 2023) - Orange County had 863 killed or injured victims in crashes involving a driver age 21 to 34 who had been drinking in 2023.
(California OTS, Orange County 2023) - Anaheim had 225 alcohol-involved killed or injured victims in 2023.
(Anaheim OTS 2023) - Huntington Beach had 172 alcohol-involved killed or injured victims in 2023.
(Huntington Beach OTS 2023) - Santa Ana had 109 alcohol-involved killed or injured victims in 2023.
(Santa Ana OTS 2023) - Fullerton had 85 alcohol-involved killed or injured victims in 2023.
(Fullerton OTS 2023) - Costa Mesa had 84 alcohol-involved killed or injured victims in 2023.
(Costa Mesa OTS 2023) - Orange had 78 alcohol-involved killed or injured victims in 2023.
(Orange OTS 2023) - Newport Beach had 71 alcohol-involved killed or injured victims in 2023.
(Newport Beach OTS 2023) - Garden Grove had 71 alcohol-involved killed or injured victims in 2023.
(Garden Grove OTS 2023) - Irvine had 55 alcohol-involved killed or injured victims in 2023.
(Irvine OTS 2023) - Westminster had 39 alcohol-involved killed or injured victims in 2023.
(Westminster OTS 2023)
DUI Arrest Notes
DUI arrest numbers provide enforcement context for individual cities. They are useful for understanding local impaired-driving enforcement activity, but they do not measure the number of DUI crashes.
- Costa Mesa reported 791 DUI arrests in 2023.
(Costa Mesa OTS 2023) - Anaheim reported 659 DUI arrests in 2023.
(Anaheim OTS 2023) - Huntington Beach reported 504 DUI arrests in 2023.
(Huntington Beach OTS 2023) - Orange reported 499 DUI arrests in 2023.
(Orange OTS 2023) - Newport Beach reported 399 DUI arrests in 2023.
(Newport Beach OTS 2023) - Irvine reported 349 DUI arrests in 2023.
(Irvine OTS 2023) - Santa Ana reported 311 DUI arrests in 2023.
(Santa Ana OTS 2023) - Fullerton reported 299 DUI arrests in 2023.
(Fullerton OTS 2023) - Westminster reported 221 DUI arrests in 2023.
(Westminster OTS 2023) - Mission Viejo reported 147 DUI arrests in 2023.
(Mission Viejo OTS 2023)
Speed-Related Accident Statistics
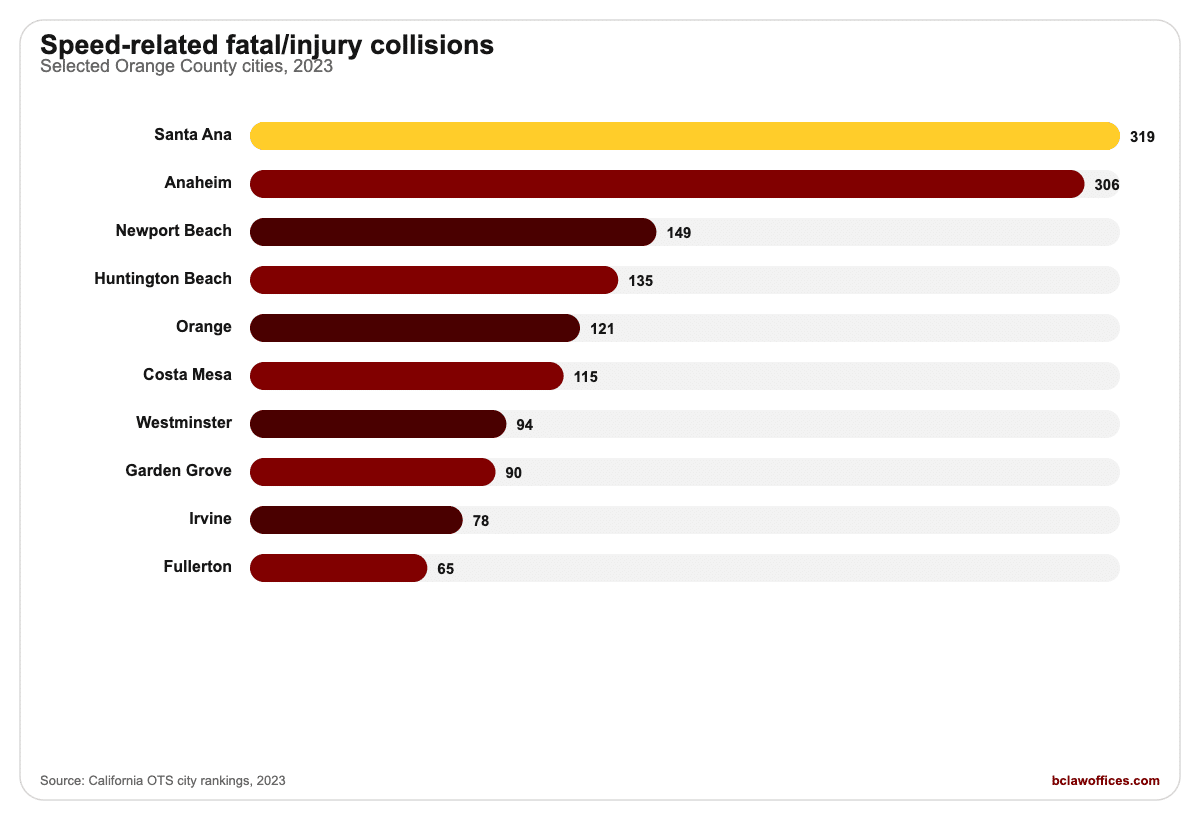
Speed is one of the most important crash factors tracked by OTS. The figures below count fatal and injury collisions where speed was reported as a related factor, not the total number of people injured in those crashes.
- Orange County had 4,062 speed-related fatal and injury collisions in 2023.
(California OTS, Orange County 2023) - Orange County ranked 51/58 among California counties for speed-related fatal and injury collisions in 2023.
(California OTS, Orange County 2023) - Santa Ana had 319 speed-related fatal and injury collisions in 2023.
(Santa Ana OTS 2023) - Anaheim had 306 speed-related fatal and injury collisions in 2023.
(Anaheim OTS 2023) - Newport Beach had 149 speed-related fatal and injury collisions in 2023.
(Newport Beach OTS 2023) - Newport Beach ranked 1/103 among Group C cities for speed-related fatal and injury collisions in 2023.
(Newport Beach OTS 2023) - Huntington Beach had 135 speed-related fatal and injury collisions in 2023.
(Huntington Beach OTS 2023) - Orange had 121 speed-related fatal and injury collisions in 2023.
(Orange OTS 2023) - Costa Mesa had 115 speed-related fatal and injury collisions in 2023.
(Costa Mesa OTS 2023) - Westminster had 94 speed-related fatal and injury collisions in 2023.
(Westminster OTS 2023) - Garden Grove had 90 speed-related fatal and injury collisions in 2023.
(Garden Grove OTS 2023) - Irvine had 78 speed-related fatal and injury collisions in 2023.
(Irvine OTS 2023) - Fullerton had 65 speed-related fatal and injury collisions in 2023.
(Fullerton OTS 2023)
Reviewed Cities by Speed-Related Fatal/Injury Collisions
Hit-and-Run Accident Statistics
Hit-and-run crash data shows how often drivers left the scene in crashes involving injuries or fatalities. These figures do not include every property-damage-only hit-and-run, so they should be read as injury-crash statistics.
- Orange County had 1,286 hit-and-run fatal and injury collisions in 2023.
(California OTS, Orange County 2023) - Orange County ranked 52/58 among California counties for hit-and-run fatal and injury collisions in 2023.
(California OTS, Orange County 2023) - Santa Ana had 229 hit-and-run fatal and injury collisions in 2023.
(Santa Ana OTS 2023) - Anaheim had 171 hit-and-run fatal and injury collisions in 2023.
(Anaheim OTS 2023) - Huntington Beach had 70 hit-and-run fatal and injury collisions in 2023.
(Huntington Beach OTS 2023) - Garden Grove had 64 hit-and-run fatal and injury collisions in 2023.
(Garden Grove OTS 2023) - Costa Mesa had 53 hit-and-run fatal and injury collisions in 2023.
(Costa Mesa OTS 2023) - Fullerton had 47 hit-and-run fatal and injury collisions in 2023.
(Fullerton OTS 2023) - Orange had 37 hit-and-run fatal and injury collisions in 2023.
(Orange OTS 2023) - Westminster had 37 hit-and-run fatal and injury collisions in 2023.
(Westminster OTS 2023) - Newport Beach had 24 hit-and-run fatal and injury collisions in 2023.
(Newport Beach OTS 2023) - Irvine had 16 hit-and-run fatal and injury collisions in 2023.
(Irvine OTS 2023)
Nighttime Crash Statistics
OTS tracks nighttime fatal and injury collisions separately because late-night hours can involve different risk factors, including impaired driving, fatigue, speeding and reduced visibility. In the OTS rankings, nighttime means crashes occurring from 9:00 p.m. through 2:59 a.m.
- Orange County had 1,827 nighttime fatal and injury collisions in 2023.
(California OTS, Orange County 2023) - Orange County ranked 57/58 among California counties for nighttime fatal and injury collisions in 2023.
(California OTS, Orange County 2023) - Anaheim had 263 nighttime fatal and injury collisions in 2023.
(Anaheim OTS 2023) - Santa Ana had 219 nighttime fatal and injury collisions in 2023.
(Santa Ana OTS 2023) - Huntington Beach had 90 nighttime fatal and injury collisions in 2023.
(Huntington Beach OTS 2023) - Garden Grove had 78 nighttime fatal and injury collisions in 2023.
(Garden Grove OTS 2023) - Costa Mesa had 72 nighttime fatal and injury collisions in 2023.
(Costa Mesa OTS 2023) - Fullerton had 67 nighttime fatal and injury collisions in 2023.
(Fullerton OTS 2023) - Orange had 61 nighttime fatal and injury collisions in 2023.
(Orange OTS 2023) - Westminster had 57 nighttime fatal and injury collisions in 2023.
(Westminster OTS 2023)
Pedestrian Accident Statistics
Pedestrian crashes are tracked separately because people walking have little physical protection when struck by a vehicle. The figures below count pedestrian victims who were killed or injured, including separate categories for children and older adults.
- Orange County had 892 pedestrian victims killed or injured in 2023.
(California OTS, Orange County 2023) - Orange County had 82 pedestrian victims under age 15 killed or injured in 2023.
(California OTS, Orange County 2023) - Orange County had 115 pedestrian victims age 65 and older killed or injured in 2023.
(California OTS, Orange County 2023) - Santa Ana had 157 pedestrian victims killed or injured in 2023.
(Santa Ana OTS 2023) - Anaheim had 96 pedestrian victims killed or injured in 2023.
(Anaheim OTS 2023) - Garden Grove had 58 pedestrian victims killed or injured in 2023.
(Garden Grove OTS 2023) - Fullerton had 58 pedestrian victims killed or injured in 2023.
(Fullerton OTS 2023) - Huntington Beach had 55 pedestrian victims killed or injured in 2023.
(Huntington Beach OTS 2023) - Orange had 50 pedestrian victims killed or injured in 2023.
(Orange OTS 2023) - Irvine had 37 pedestrian victims killed or injured in 2023.
(Irvine OTS 2023) - Newport Beach had 37 pedestrian victims killed or injured in 2023.
(Newport Beach OTS 2023) - Westminster had 35 pedestrian victims killed or injured in 2023.
(Westminster OTS 2023) - Tustin had 31 pedestrian victims killed or injured in 2023.
(Tustin OTS 2023)
Bicycle Accident Statistics
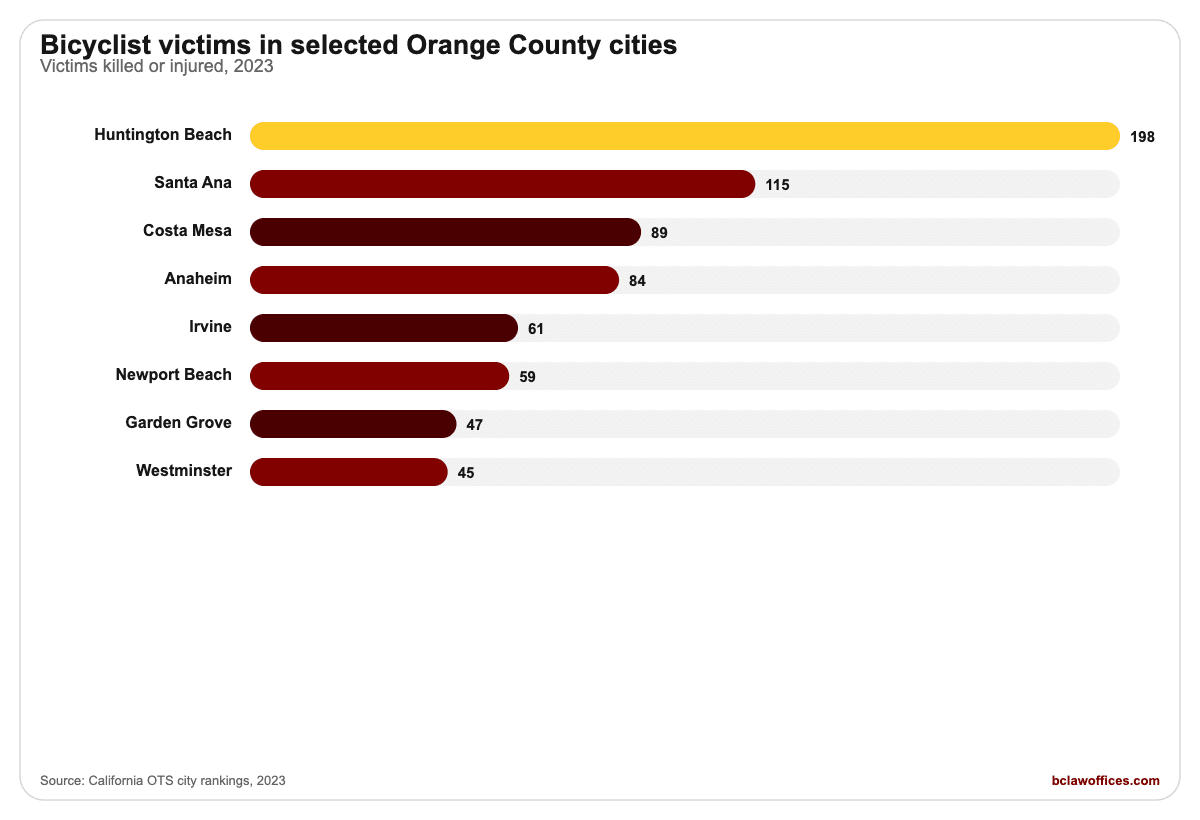
Bicycle crashes make up a significant part of Orange County’s injury-crash data. OTS tracks bicyclist victims separately from overall fatal-and-injury crash totals, including separate figures for bicyclists under age 15. These numbers help show where riders, families and drivers face the greatest safety risks.
- Orange County had 1,116 bicyclist victims killed or injured in 2023.
(California OTS, Orange County 2023) - Orange County had 196 bicyclist victims under 15 killed or injured in 2023.
(California OTS, Orange County 2023) - Orange County ranked 2/58 among California counties for bicyclist victims under 15 in 2023.
(California OTS, Orange County 2023) - Huntington Beach had 198 bicyclist victims killed or injured in 2023.
(Huntington Beach OTS 2023) - Huntington Beach ranked 1/62 among Group B cities for bicyclist victims in 2023.
(Huntington Beach OTS 2023) - Huntington Beach had 34 bicyclist victims under 15 killed or injured in 2023.
(Huntington Beach OTS 2023) - Santa Ana had 115 bicyclist victims killed or injured in 2023.
(Santa Ana OTS 2023) - Costa Mesa had 89 bicyclist victims killed or injured in 2023.
(Costa Mesa OTS 2023) - Costa Mesa ranked 3/62 among Group B cities for bicyclist victims in 2023.
(Costa Mesa OTS 2023) - Anaheim had 84 bicyclist victims killed or injured in 2023.
(Anaheim OTS 2023) - Irvine had 61 bicyclist victims killed or injured in 2023.
(Irvine OTS 2023) - Irvine had 24 bicyclist victims under 15 killed or injured in 2023.
(Irvine OTS 2023) - Irvine ranked 1/15 among Group A cities for bicyclist victims under 15 in 2023.
(Irvine OTS 2023) - Newport Beach had 59 bicyclist victims killed or injured in 2023.
(Newport Beach OTS 2023) - Garden Grove had 47 bicyclist victims killed or injured in 2023.
(Garden Grove OTS 2023) - Westminster had 45 bicyclist victims killed or injured in 2023.
(Westminster OTS 2023)
Bicycle Victims in Selected Orange County Cities
Motorcycle Accident Statistics
Motorcycle crashes often involve serious injuries because riders have far less protection than people inside passenger vehicles. The OTS figures below count motorcycle-involved victims who were killed or injured; they do not determine who was legally at fault.
- Orange County had 902 motorcycle victims killed or injured in 2023.
(California OTS, Orange County 2023) - Orange County ranked 32/58 among California counties for motorcycle victims in 2023.
(California OTS, Orange County 2023) - Anaheim had 79 motorcycle victims killed or injured in 2023.
(Anaheim OTS 2023) - Santa Ana had 64 motorcycle victims killed or injured in 2023.
(Santa Ana OTS 2023) - Huntington Beach had 52 motorcycle victims killed or injured in 2023.
(Huntington Beach OTS 2023) - Costa Mesa had 44 motorcycle victims killed or injured in 2023.
(Costa Mesa OTS 2023) - Fullerton had 43 motorcycle victims killed or injured in 2023.
(Fullerton OTS 2023) - Orange had 38 motorcycle victims killed or injured in 2023.
(Orange OTS 2023) - Westminster had 35 motorcycle victims killed or injured in 2023.
(Westminster OTS 2023) - Westminster ranked 13/103 among Group C cities for motorcycle victims in 2023.
(Westminster OTS 2023) - Garden Grove had 24 motorcycle victims killed or injured in 2023.
(Garden Grove OTS 2023) - Irvine had 23 motorcycle victims killed or injured in 2023.
(Irvine OTS 2023)
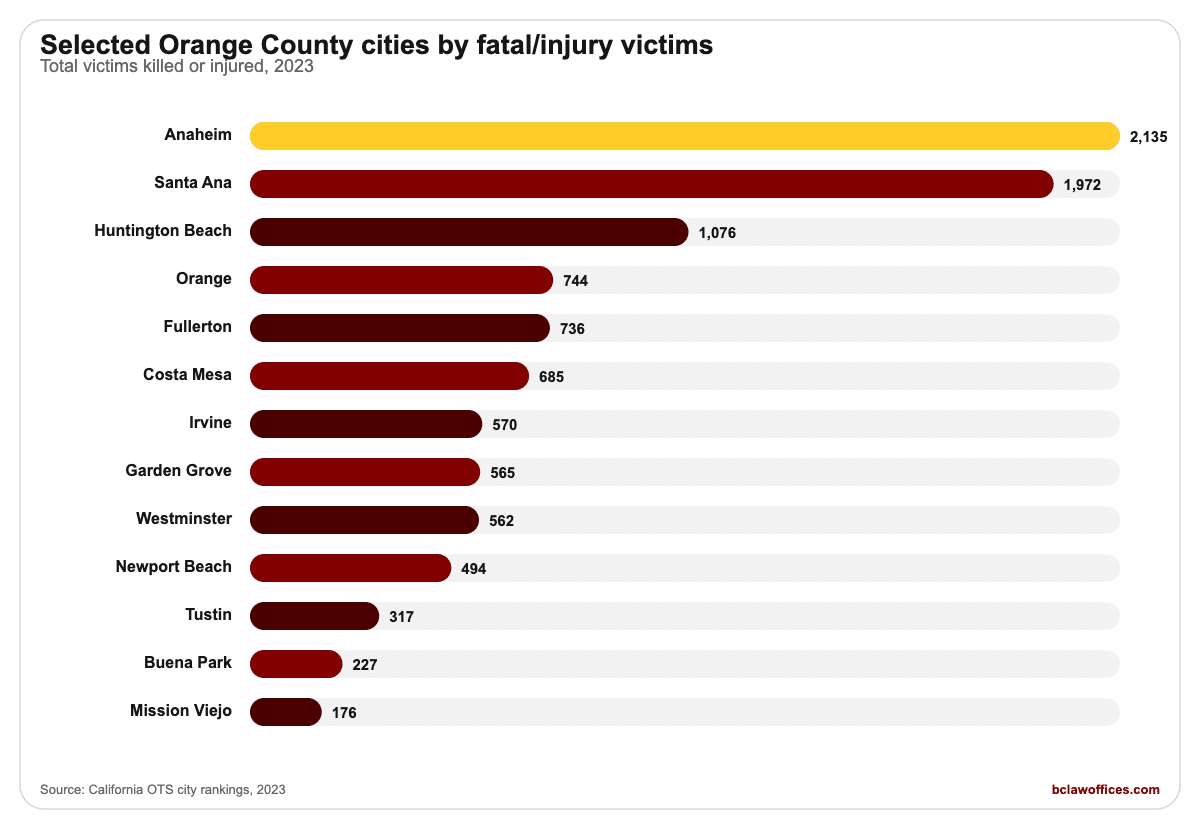
City-Level Orange County Car Accident Statistics
City-level OTS data helps show how crash patterns differ across Orange County. These figures are useful for local comparisons, but rankings should be read carefully because OTS compares cities within population groups rather than ranking every city against every other city statewide.
- Anaheim had 2,135 total fatal-and-injury victims in 2023.
(Anaheim OTS 2023) - Santa Ana had 1,972 total fatal-and-injury victims in 2023.
(Santa Ana OTS 2023) - Huntington Beach had 1,076 total fatal-and-injury victims in 2023.
(Huntington Beach OTS 2023) - Orange had 744 total fatal-and-injury victims in 2023.
(Orange OTS 2023) - Fullerton had 736 total fatal-and-injury victims in 2023.
(Fullerton OTS 2023) - Costa Mesa had 685 total fatal-and-injury victims in 2023.
(Costa Mesa OTS 2023) - Irvine had 570 total fatal-and-injury victims in 2023.
(Irvine OTS 2023) - Garden Grove had 565 total fatal-and-injury victims in 2023.
(Garden Grove OTS 2023) - Westminster had 562 total fatal-and-injury victims in 2023.
(Westminster OTS 2023) - Newport Beach had 494 total fatal-and-injury victims in 2023.
(Newport Beach OTS 2023) - Tustin had 317 total fatal-and-injury victims in 2023.
(Tustin OTS 2023) - Buena Park had 227 total fatal-and-injury victims in 2023.
(Buena Park OTS 2023) - Mission Viejo had 176 total fatal-and-injury victims in 2023.
(Mission Viejo OTS 2023)
Reviewed Orange County Cities by Total Fatal/Injury Victims
What These Statistics Mean for Orange County Drivers
The numbers above are useful because they show where Orange County crash risks appear most often: speeding, alcohol involvement, hit-and-runs, nighttime crashes and vulnerable road users. For individual accident victims, however, the facts of the specific crash matter more than countywide trends.
Orange County crash data is not one single number
The most important distinction is between victims and collisions. One crash can injure more than one person. OTS also separates total fatal-and-injury victims from categories such as speed-related fatal/injury collisions and hit-and-run fatal/injury collisions.
Bicycle and pedestrian crashes deserve separate attention
Orange County reported 1,116 bicyclist victims and 892 pedestrian victims killed or injured in 2023. Those numbers are separate from total vehicle-only collision categories. Bicycle and pedestrian cases also raise different evidence questions, including visibility, roadway design, right-of-way, traffic signals, speed, and witness evidence.
Rankings are not legal fault findings
OTS rankings are public-safety indicators. They are not determinations of negligence, liability, or civil fault. A personal injury claim depends on the facts of the individual crash.
City comparisons need context
Anaheim and Santa Ana had high total victim counts among reviewed cities, while Newport Beach ranked 1/103 in its group for speed-related fatal and injury collisions. Those figures describe different cities, groups and units. They should be cited carefully.
Methodology and Source Notes
This guide uses official California traffic-safety sources wherever possible. Most figures come from California Office of Traffic Safety ranking pages, with supporting methodology from OTS and Caltrans road-safety data resources.
Important source rules:
- OTS killed/injured figures exclude damage-only or fender-bender crashes.
(OTS methodology) - OTS rankings use SWITRS crash data, Department of Finance population estimates, and Caltrans daily vehicle miles traveled.
(OTS methodology) - For OTS rankings, number 1 is the highest or “worst” ranking.
(OTS methodology) - County rankings include crashes, killed, and injured on all roadways within county limits.
(OTS methodology) - Caltrans identifies TIMS as a source for California crash data from SWITRS and notes that TIMS does not include property-damage-only crashes.
(Caltrans Road Safety Data Resources)
Frequently Asked Questions
How many people were killed or injured in Orange County car accidents in 2023?
Orange County had 17,809 victims killed or injured in total fatal-and-injury crashes in 2023. This figure does not include property-damage-only crashes.
(California OTS, Orange County 2023)
How many Orange County crashes involved alcohol in 2023?
Orange County had 1,771 alcohol-involved victims killed or injured in 2023. This is a victim count, not a total number of DUI arrests or all alcohol-related incidents.
(California OTS, Orange County 2023)
How many speed-related injury crashes happened in Orange County in 2023?
Orange County had 4,062 speed-related fatal and injury collisions in 2023.
(California OTS, Orange County 2023)
How many hit-and-run injury crashes happened in Orange County in 2023?
Orange County had 1,286 hit-and-run fatal and injury collisions in 2023. This does not include property-damage-only hit-and-runs.
(California OTS, Orange County 2023)
Which reviewed Orange County city had the most total fatal-and-injury victims in 2023?
Among the reviewed city OTS pages, Anaheim had the highest total, with 2,135 total fatal-and-injury victims in 2023. Santa Ana followed with 1,972.
(Anaheim OTS 2023), (Santa Ana OTS 2023)
How many bicyclists were killed or injured in Orange County crashes in 2023?
Orange County had 1,116 bicyclist victims killed or injured in 2023. The county also had 196 bicyclist victims under age 15 killed or injured.
(California OTS, Orange County 2023)
Full Source List
- California Office of Traffic Safety: Orange County 2023
- California Office of Traffic Safety: Orange County 2022
- California Office of Traffic Safety: Crash Rankings Methodology
- Caltrans: Road Safety Data Resources
- California OTS: Anaheim 2023
- California OTS: Santa Ana 2023
- California OTS: Irvine 2023
- California OTS: Huntington Beach 2023
- California OTS: Garden Grove 2023
- California OTS: Fullerton 2023
- California OTS: Costa Mesa 2023
- California OTS: Orange 2023
- California OTS: Newport Beach 2023
- California OTS: Mission Viejo 2023
- California OTS: Tustin 2023
- California OTS: Buena Park 2023
- California OTS: Westminster 2023
Talk With an Attorney, for Free
Crash statistics can show the risks on Orange County roads, but every accident case depends on the facts. If you were injured and have questions about fault, insurance, medical bills or your next steps, the Law Offices of Brent W. Caldwell is available to help.
You can start with a free case evaluation. There is no obligation, no upfront fee, and no attorney fee unless there is a recovery.